
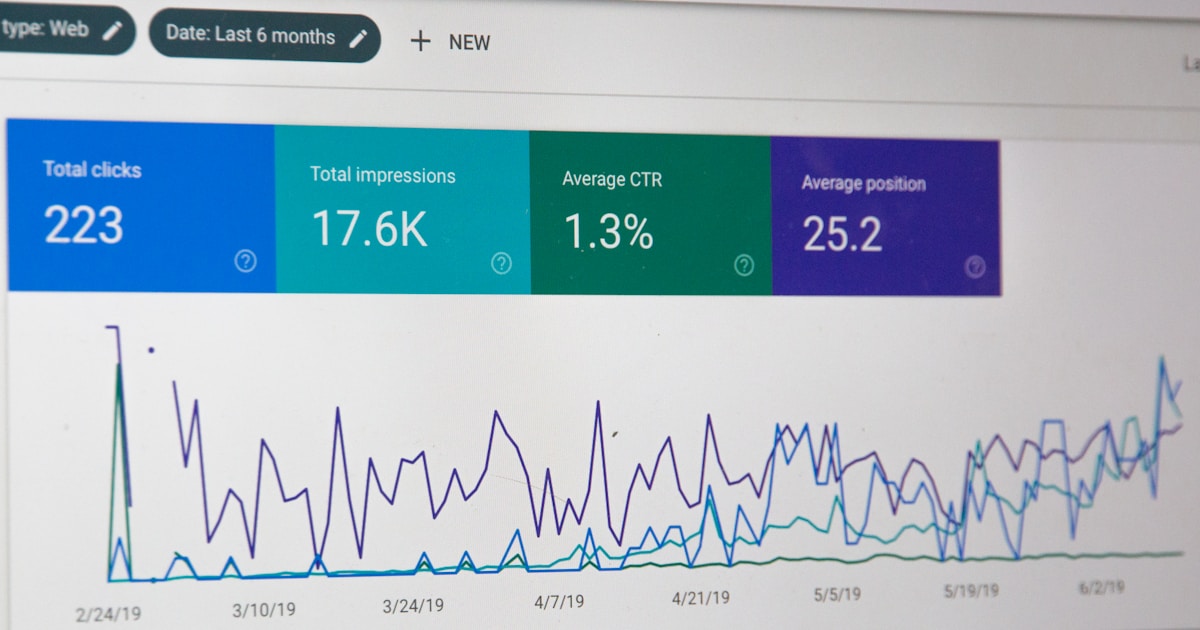
Your accountant sends a report. You look at it, nod, file it, and carry on making the same decisions you were going to make anyway. The quote goes out at the same margin. The new hire happens on the same gut feel. The equipment purchase is approved on the same assumption that “the work will keep coming”. Nothing in the report changed what you did next — which means the report, however neatly formatted, is not reporting. It’s record keeping. For Perth manufacturing businesses, a Fractional CFO Perth partner builds the kind of reporting that tells you what to do next, not just what happened last month.
Reports That Look Backwards Don’t Help You Move Forwards
A standard profit and loss tells you what happened. By the time you read it — usually 3 to 6 weeks after month-end — you’re already past the decisions that drove those numbers. The quote has gone out. The job is half-done. The overtime is already approved. What a manufacturing business in Perth actually needs is visibility by product line or customer, cost per unit across different runs, margin trends before they become problems, and a forward view of cash and capacity. That’s not an annual exercise or a compliance artefact — it’s a monthly tool that makes the business clearer every time you look at it.
The Three Types of Reporting, and Why Most Businesses Only Have One
Reporting lives at three levels. Compliance reporting — BAS, tax, statutory accounts — is what your accountant provides. Operational reporting — production output, quality metrics, delivery performance — is what your shop-floor systems produce. Management reporting — margin by SKU, cashflow forecast, capex pipeline, KPI dashboards — is the layer most SME manufacturers are missing entirely. Compliance is done. Operational is done. Management is where the commercial decisions actually live, and it’s the layer a fractional CFO builds.
Why Most Monthly Reports Don’t Drive Anything
Three common problems sit behind reports that get filed and forgotten. First, they’re too generic — a standard P&L in standard categories that could be any business. Second, they arrive too late — 30, 45, sometimes 60 days after the month they cover. Third, there’s no commentary, no conversation, no owner-level review session where the numbers turn into decisions. Without all three fixed, reporting stays a ritual rather than a tool.
The Monthly Rhythm That Actually Works
The rhythm that works in most Perth manufacturing businesses runs on a 10-day cycle. Day 1 to 5 of the new month: bookkeeper closes the prior month. Day 5 to 8: the CFO reviews, adjusts, and builds commentary. Day 10: owner receives the pack. Day 12 to 15: a 60-90 minute review session that covers three things — what last month is telling us, what decisions need to be made in the next 30 days, and what’s moving on the 12-month plan. That’s it. No heroics. Just a cadence that makes the business steerable.
Reporting That Drives Decisions, Not Just Compliance
At 360 Fox, we work with manufacturing businesses to design management reporting around how the business actually operates — not a generic template. Every manufacturer is different. A food processor measures differently to a metal fabricator. A custom engineering shop measures differently to a high-volume plastics moulder. The reporting has to reflect the product mix, the production model, the cost structure, and the decisions the owner is actually making.
The Core Monthly Pack for a Perth Manufacturer
| Report | What It Shows | Decision It Drives |
|---|---|---|
| Revenue & Margin by Product Line | Gross margin % for top 5 SKUs or product families | Pricing, product rationalisation |
| Labour Productivity | Revenue per direct labour dollar, trend 12 months | Hiring, rostering, training |
| Machine Utilisation | Productive hours / available hours, by asset | Capex, shift patterns, outsourcing |
| Scrap & Rework | % of material cost, trend | Process control, training |
| 13-Week Cash Forecast | Weekly cash position with commitments | Payroll, BAS, supplier timing |
| Debtors & Inventory Days | Working capital tied up | Collections, stock policy |
| KPI Dashboard (1 page) | 6-8 headline numbers, RAG-coded | Monthly action list |
What a Report Should Not Be
It should not be 40 pages. It should not be raw ledger data. It should not require accounting fluency to read. And it should never be delivered without commentary — numbers without interpretation are just data. The owner’s time is better spent on the “so what” than on the spreadsheet itself.
An Illustrative Perth Manufacturing Scenario
The following is a composite scenario based on typical Perth engagements — not a real client. Numbers are representative of the sorts of businesses we work with.
Consider a Perth plastics and component manufacturer on $7.2M turnover, servicing mining, agriculture and construction OEMs, with three main product families — injection-moulded components, custom fabrication, and a smaller maintenance supply business. The owner had been receiving a monthly P&L for years. It never changed how he ran the business. When we rebuilt the reporting, three things surfaced fast.
The injection-moulded product family was believed to be the most profitable — biggest volume, biggest revenue line. Actual gross margin, once machine time, labour and material waste were properly allocated, was 19.2%. The custom fabrication line, treated as secondary, was running at 37.8%. The maintenance supply business, almost an afterthought, was running at 44.5% on $950,000 of revenue. With that visibility, the owner repriced 30% of the injection-moulded book, walked away from two low-margin contracts, and hired a dedicated business development lead for the maintenance supply stream. Inside 12 months, operating margin moved from 6.1% to 11.7%. Revenue was only 4% higher. The business didn’t grow — it re-weighted, and the profit line followed.
The Capex Decision That Waited
The same owner had been planning to invest $620,000 in a new, faster injection-moulding machine on the assumption that more volume would help the business. With the real margin data in front of him, the investment was paused. The capital was redirected into fabrication capacity, where the margin profile justified it. Return on invested capital over the following two years moved materially higher than it would have under the original plan. That single decision, made because the reporting finally told the truth, was worth more than a decade of the fractional CFO fee.
How 360 Fox Works With Perth Manufacturing Businesses
Fractional CFO Perth engagements for manufacturers start with one principle: the reporting has to change the decisions the owner makes, or it’s not worth producing. Our team designs the management reporting layer specifically for the business — the product families, the production model, the cost drivers that matter. We then install the monthly rhythm and sit in the decisions the numbers point to. The CFO Services page covers the broader engagement scope.
What Actually Changes on the Factory Floor
Not much, directly. The CFO isn’t walking the shop floor setting up machines. What changes is upstream — in quoting, pricing, procurement, capex, hiring. Those changes then reach the factory floor as clearer direction and better-funded capacity. The shop-floor team usually notices that quoting gets tighter and equipment decisions become better supported, rather than noticing the CFO at all.
Who This Suits
Perth manufacturers between $3M and $30M turnover, making decisions about pricing, capex, hiring and product mix that matter financially. Food and beverage, plastics and rubber, metal fabrication, precision engineering, building products, custom machinery, electrical assembly. The framework adapts; the principles don’t.
Frequently Asked Questions
- We already get a monthly P&L. Isn’t that enough?
Probably not. Ask yourself whether last month’s P&L changed a single decision you made. If not, the reporting is a record, not a tool. Useful management reporting is timely, specific to the business, and comes with commentary tied to decisions. - How long before reporting actually changes how we run the business?
Usually by the third monthly cycle the conversations start to shift — quoting, pricing and hiring start referencing the numbers. By the sixth month it’s habitual. By 12 months you can’t imagine running the business without it. - Does this require new software?
Rarely. Most manufacturers already have Xero or MYOB, a job tracking tool, and production data. The CFO role is to pull the right data together into a decision-grade reporting layer, not to replace the operational stack. - What if we don’t have clean data?
Almost no SME manufacturer does on day one. Part of the early work is cleaning up the chart of accounts, fixing how costs are coded, and getting the data into a shape that supports the reporting. This usually takes 30 to 60 days. - What does an engagement cost?
For a Perth manufacturer between $3M and $20M turnover, engagements typically range from $3,500 to $8,500 per month depending on complexity, reporting scope and meeting rhythm. Most clients recover the annual fee from one or two well-informed pricing or capex decisions.
Numbers that don’t change behaviour aren’t reporting — they’re record-keeping. When the monthly pack actually drives decisions on quoting, pricing, hiring and capex, the business becomes sharper every month. That’s the point. Not to add work. To make the work you’re already doing far more productive.
Not sure where your numbers are leaking?
360 Fox works with Perth business owners to find the gaps, fix the reporting, and build a financial plan that actually works. No jargon. No lock-in. Just clarity.